F.A.Q
The PixiJS Devtools don't show up
Here are some troubleshooting steps to help you if you don't the PixiJS devtools in your browser:
-
Check if the extension is installed and enabled:
Open the Chrome extensions page by typing
chrome://extensionsin the address bar. Make sure the PixiJS Devtools extension is installed and enabled. If it's not installed, please read the installation guide. -
Try closing the devtools pane, refreshing the page and opening the devtools pane again**.
-
Try restarting the browser or the computer.
-
If you have multiple pages with the PixiJS Devtools open, try closing all of them and opening a new one.
-
If you have multiple versions of the devtools installed, it's recommended to disable/remove the others. n
-
Look for errors in the browser Console.
If you see any errors, please report them in the GitHub issues.
Scene isn't updating in the Devtools
If the scene isn't updating in the devtools, try the following steps:
- Close the devtools pane.
- Refresh the page.
- Open the devtools pane again.
If the scene still isn't updating, try looking for errors in the console:
-
Open the browser console, you can do this by pressing
ESC -
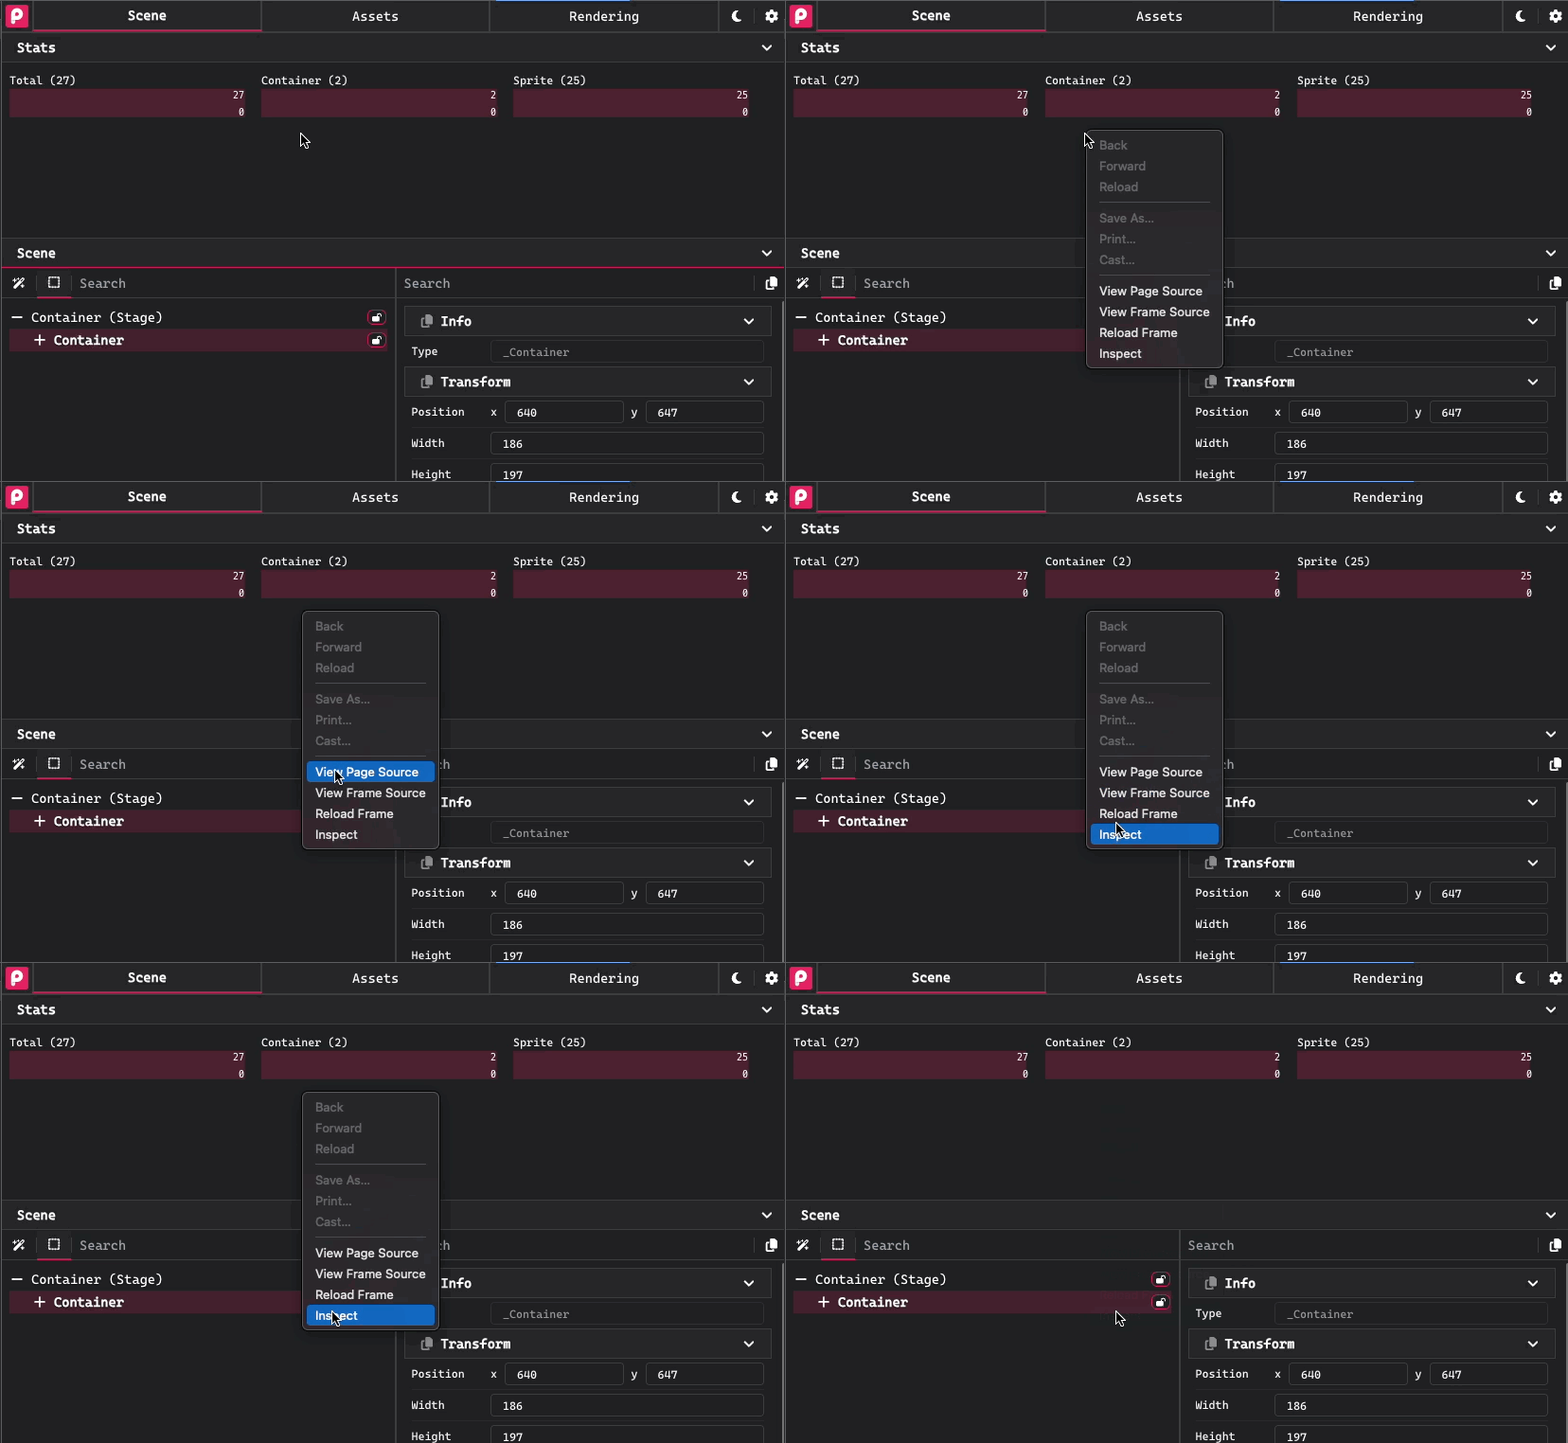
Look for errors in the devtools Console. You can open the devtools console by right-clicking on the devtools pane and selecting "Inspect".
How to open the devtools console

If you see any errors, please report them in the GitHub issues.
Property is not displayed
If a property is not displayed in the devtools, it might be because the property is not set on the object.
For example, the filterArea property is not displayed in the devtool until it's set on the object in your code.
To get the property to display, you can set it on the object like this:
const sprite = new Sprite(texture);
sprite.filterArea = new Rectangle(0, 0, 100, 100);
If you think a property should be displayed, please report it in the GitHub issues.